Introduction
This article details the implementation of the Ploosh automated testing framework within the Microsoft Fabric ecosystem. We will rely on a concrete use case: validating the results of workloads writing data to Lakehouse tables and events to Kusto tables, distributed across multiple workspaces.
Ploosh positions itself as a validation framework for data projects. It allows you to define tests declaratively and execute them automatically to generate quality reports, while alerting teams in case of non-compliance or anomalies.
The framework offers two execution modes:
- Native mode: Ideal for local execution or via a classic CI/CD agent.
- Spark mode: Designed to run within a Spark cluster, enabling distributed processing of large data volumes.
This use case specifically leverages Spark mode in Microsoft Fabric, thereby taking advantage of the platform's distributed computing power to efficiently validate data pipelines.
Architecture and Implementation
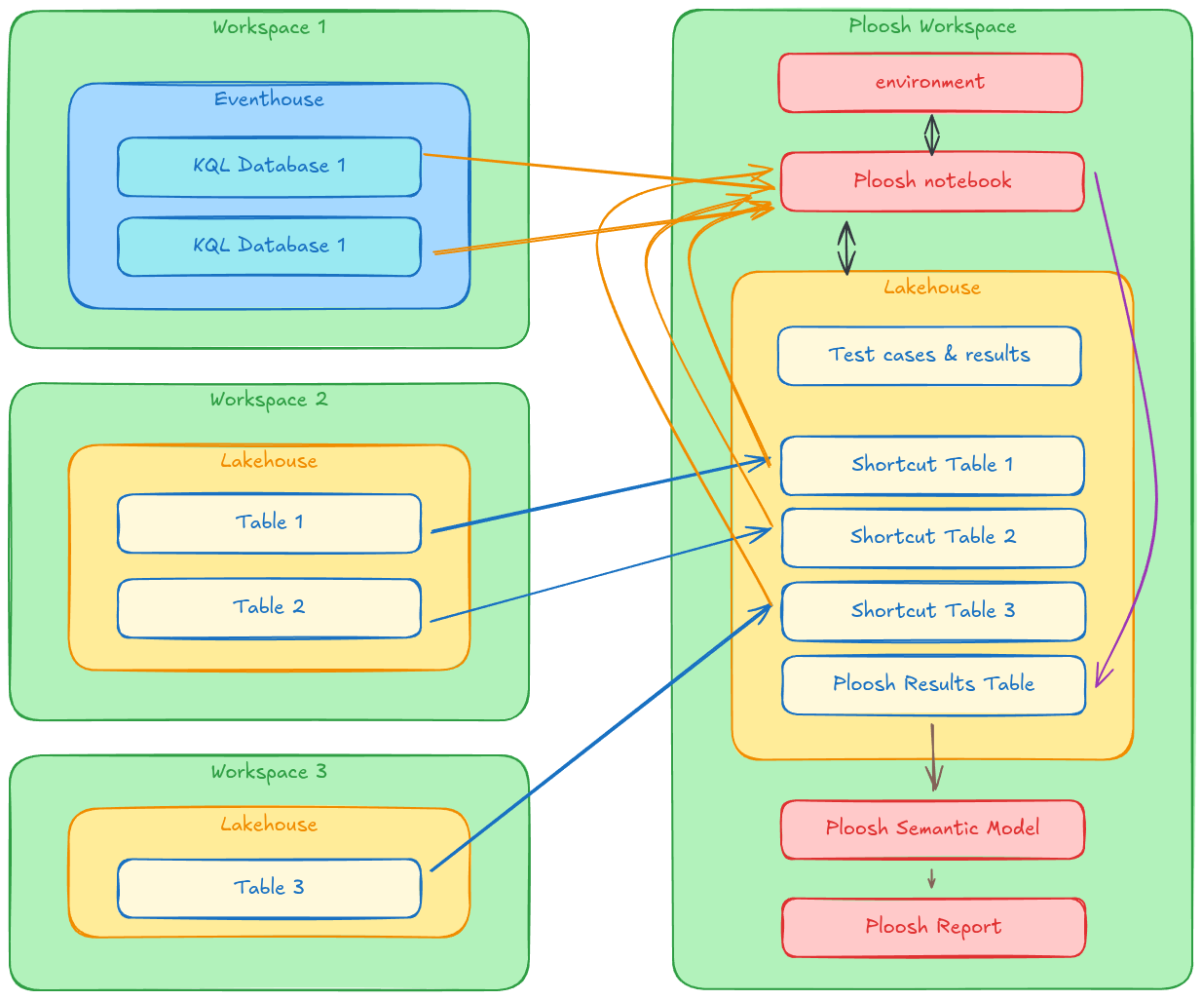
The architecture is based on a dedicated Fabric workspace, structured as follows:
- Python environment: The Ploosh package is pre-installed and configured by default.
- Central Lakehouse hosting:
- Notebook: Orchestrates test execution and history tracking.
- Semantic model: Exposes results for analysis.
- Power BI reports: Provide clear visualization of data quality.
The Execution Environment
The Fabric environment is configured with the Ploosh package (installed viapip). This configuration allows invoking Ploosh directly from a Fabric notebook using Spark as the execution engine. This is a major advantage for processing large volumes distributed across multiple workspaces. Using a dedicated environment ensures code portability and immediate availability of dependencies during execution.The Central Role of Lakehouse
The Lakehouse is the cornerstone of this architecture. It acts as a single repository for tests (YAML definitions, reference data) and results. Most importantly, it centralizes access to heterogeneous data via the shortcuts mechanism.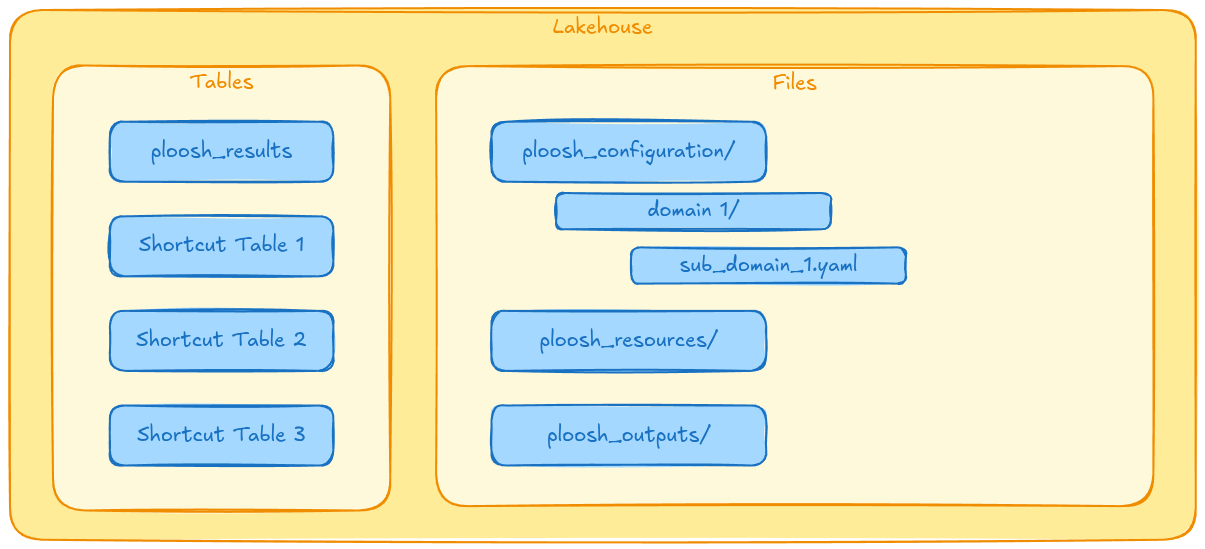
The Shortcuts Strategy
Ploosh has native connectors to interact with various sources.- For Kusto (KQL Database): Ploosh uses the Kusto Spark connector, authenticating via cluster information (URI, database, table, credentials).
- For Lakehouse (Spark SQL): To execute Spark SQL queries on data located in other workspaces, they must be made visible locally. This is where shortcuts come in: all source Lakehouses are linked to the "Ploosh" workspace via shortcuts, making their tables queryable as if they were local.
File Organization
The folder structure within the Lakehouse is standardized:ploosh_cases: Contains test definitions (YAML).ploosh_resources: Hosts reference data needed for validations.ploosh_outputs: Receives output artifacts (statistics, statuses, Excel variance files).
Results History Tracking
A Delta tableploosh_results ensures results persistence. It captures key metrics such as test name, final status (Success/Failure), variance details, execution timestamp, and SQL queries executed. It transforms the ephemeral content of output JSON files into an exploitable history for monitoring.The Orchestration Notebook
The Fabric notebook serves as the entry point for automation. Its logic is sequential:
- Loading: It reads test definitions from the Lakehouse.
- Execution: It launches the Ploosh engine in Spark mode. It accepts the target folder and file pattern as parameters, offering flexibility to execute a complete suite or a unit test.
- History tracking: It ingests raw JSON results, transforms them to match the target schema, and inserts them into the history table.
Here is an example of a typical implementation of this type of notebook:
Cell 1: The parameters
casessubfolder = "/"
cases_filter = "*.yaml"
Cell 2: The imports
from ploosh import execute_cases
from pyspark.sql.functions import col, lit, to_date
from pyspark.sql.types import StructType, StructField, StringType, DoubleType, LongType, ArrayType, TimestampType, DateType
Cell 3: The ploosh execution
outputfolder = "plooshresults"casesfolderpath = f"/lakehouse/default/Files/plooshcases{casessub_folder}"
connectionsfile = f"/lakehouse/default/Files/plooshconnections.yaml"
outputpath = f"/lakehouse/default/Files/{outputfolder}"
executecases(cases = casesfolderpath, connections = connectionsfile, sparksession = spark, filter=casesfilter, pathoutput=outputpath)
Cell 4: The results history tracking
sparkouputpath = f"Files/{outputfolder}/json/testresults.json"schema = StructType([
StructField("execution_id", StringType(), True),
StructField("name", StringType(), True),
StructField("state", StringType(), True),
StructField("source", StructType([
StructField("start", TimestampType(), True),
StructField("end", TimestampType(), True),
StructField("duration", DoubleType(), True),
StructField("count", LongType(), True),
StructField("executed_action", StringType(), True)
]), True),
StructField("expected", StructType([
StructField("start", TimestampType(), True),
StructField("end", TimestampType(), True),
StructField("duration", DoubleType(), True),
StructField("count", LongType(), True),
StructField("executed_action", StringType(), True)
]), True),
StructField("compare", StructType([
StructField("start", TimestampType(), True),
StructField("end", TimestampType(), True),
StructField("duration", DoubleType(), True),
StructField("success_rate", DoubleType(), True)
]), True),
StructField("error", StructType([
StructField("type", StringType(), True),
StructField("message", StringType(), True),
StructField("detailfilepath", StringType(), True)
]), True)
])
df = spark.read.schema(schema).option("multiline", "true").json(sparkouputpath)
name_parts = split(col("name"), "/")
flattencolsto_select = [
# global metadata
col("execution_id").cast("string"),
col("name").cast("string"),
col("state").cast("string"),
todate(col("source.start")).alias("executiondate"),
# source statistics
col("source.start").cast("timestamp").alias("source_start"),
col("source.end").cast("timestamp").alias("source_end"),
col("source.duration").cast("double").alias("source_duration"),
col("source.count").cast("integer").alias("source_count"),
col("source.executedaction").cast("string").alias("sourceexecuted_action"),
# expected statistics
col("expected.start").cast("timestamp").alias("expected_start"),
col("expected.end").cast("timestamp").alias("expected_end"),
col("expected.duration").cast("double").alias("expected_duration"),
col("expected.count").cast("integer").alias("expected_count"),
col("expected.executedaction").cast("string").alias("expectedexecuted_action"),
# compare statistics
col("compare.start").cast("timestamp").alias("compare_start"),
col("compare.end").cast("timestamp").alias("compare_end"),
col("compare.duration").cast("double").alias("compare_duration"),
col("compare.successrate").cast("double").alias("comparesuccess_rate"),
# errors columns
col("error.type").cast("string").alias("error_type"),
col("error.message").cast("string").alias("error_message"),
col("error.detailfilepath").cast("string").alias("errordetailfile_path"),
]
Save results to table
dfflat = df.select(*flattencolstoselect)
df_flat.write.mode("append") \
.option("mergeSchema", "true") \
.saveAsTable("ploosh_results")
Industrialization and DevOps
To fully integrate these tests into the software development lifecycle (SDLC), several improvement axes are possible:- Versioning (Git): Connect the workspace to a source control manager (Azure DevOps, GitHub) to version YAML tests and reference data. This ensures traceability and facilitates collaboration.
- CI/CD: Implement automatic deployment pipelines. Each modification in the repository would trigger an update of test files in the Lakehouse, guaranteeing constant alignment between code and tests.
- Alerting: Configure automatic notifications (Teams, Outlook) triggered by the notebook or a Data Activator in case of critical failure, to reduce response time (MTTR).
- Advanced analytics: Enrich Power BI reports with trend analyses to detect progressive data quality degradation before it becomes critical.
Conclusion
The integration of Ploosh in Microsoft Fabric is a robust response to data quality challenges at scale. By combining Ploosh's declarative flexibility with the distributed computing power of Spark on Fabric, data teams have a powerful tool to ensure the reliability of their deliverables, while paving the way for a true DataOps approach.
Once the setup is in place, it is now a matter of applying the most relevant testing approaches. As I detailed in a previous article, the 3 key approaches to automating tests with ploosh are perfectly suited to Microsoft Fabric projects.